Bitcoin is consolidating around $83.5K after bouncing from the mid-$70K area. While the daily chart shows a constructive higher-timeframe structure, BTC is facing significant resistance, and short-term momentum has cooled. The Apparent Demand Growth metric on CryptoQuant has recently leaned negative, suggesting the demand backdrop has not yet confirmed another sustained leg higher.
Daily Chart Analysis
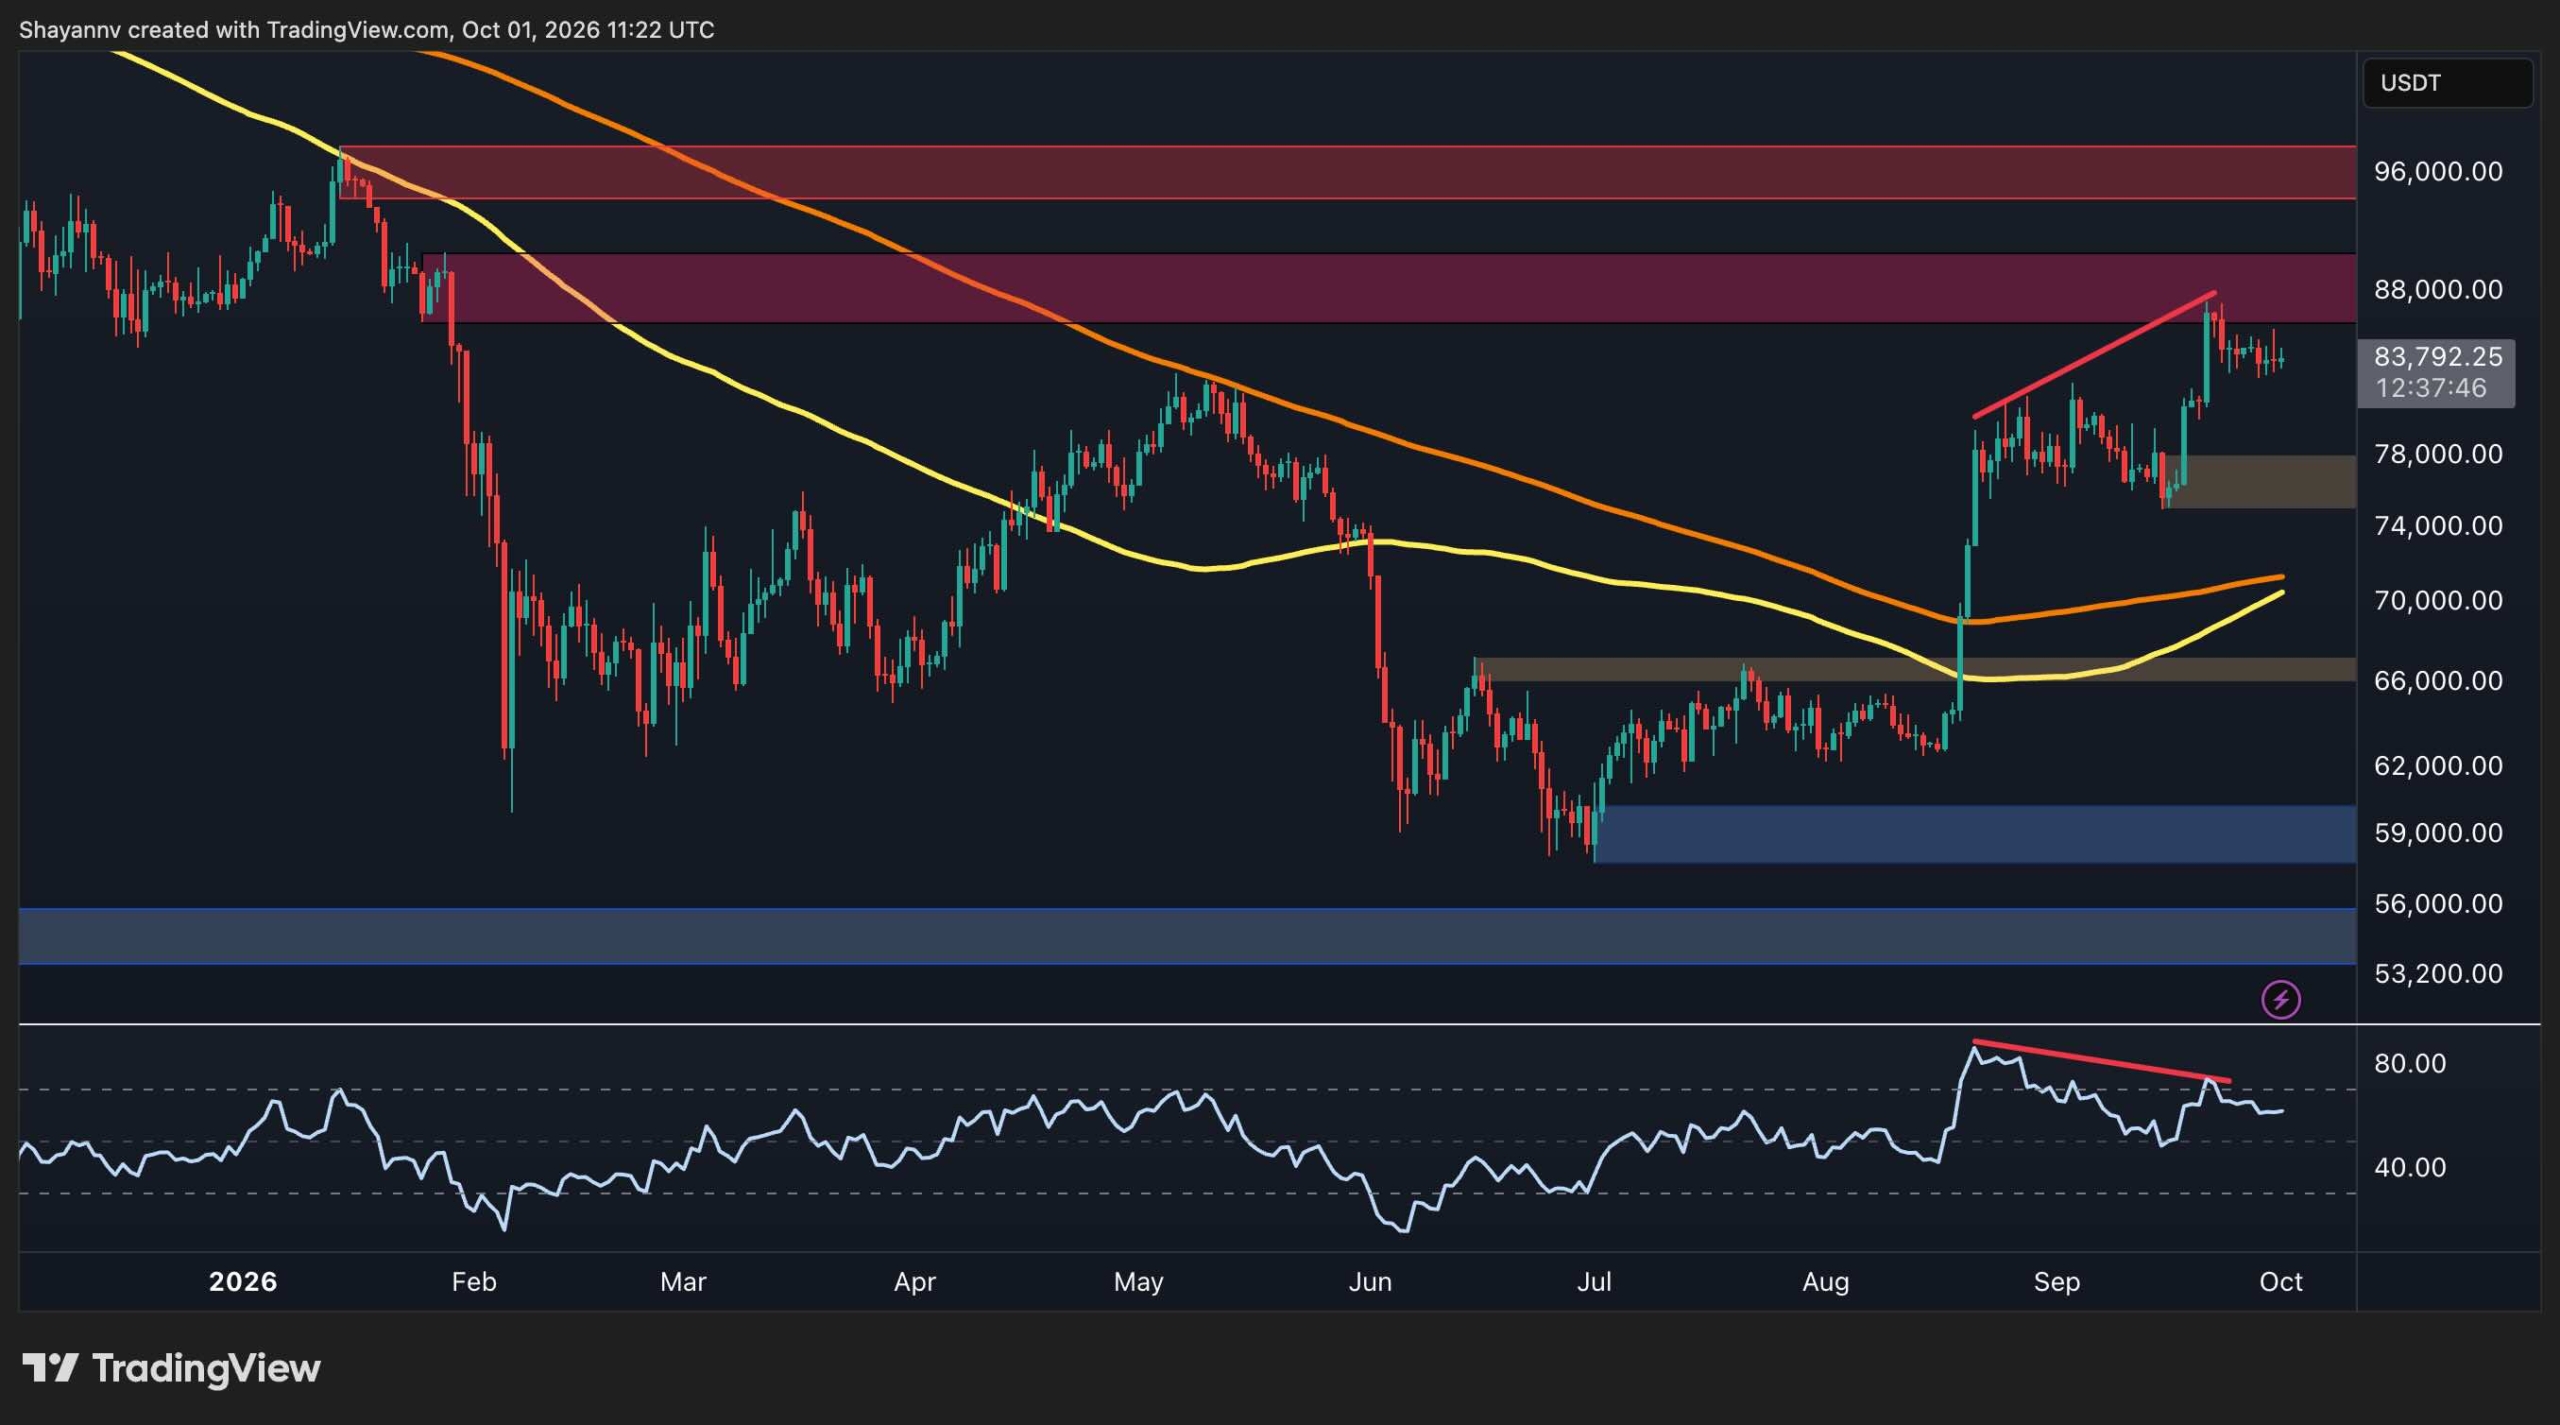
Bitcoin's daily chart shows substantial recovery from the $76K region. BTC reclaimed the $66K area and accelerated above the $70K and $78K levels, eventually reaching the $88K resistance zone. The latest rally stalled just below this area, which had previously acted as a rejection zone. A move above $88K would represent an important structural development, potentially opening the way toward the higher resistance zone around $96K.
On the downside, the first notable support is around $76K, where the latest rally originated. A deeper support zone exists around the $66K area, which remains the most important structural level at the top of the previous consolidation range.
The 100-day and 200-day moving averages have improved considerably. BTC has reclaimed both after spending much of the earlier part of the year below them. The 100-day moving average is now turning upward aggressively toward the 200-day average, pointing to a potential bullish crossover in the coming weeks. However, BTC needs to clear the $88K resistance area to demonstrate stronger continuation.
The daily RSI has recovered from earlier weakness but is no longer near recent highs. A bearish divergence is visible between the latest price advance and the RSI, with price making a higher high while momentum failed to establish a comparable high. This indicates that upside momentum has become less convincing while price is stalling below a major resistance zone.
4-Hour Chart Structure
The 4-hour chart provides a clearer picture of the consolidation visible on the daily timeframe. After surging from roughly $75K to above $86K, Bitcoin entered a sideways-to-slightly bearish formation bounded by two descending trendlines.
BTC is currently trading near $83.8K, roughly in the middle of this short-term range. The upper trendline is approaching the $85K area, while the lower boundary is currently around $82K.
A breakout above the descending upper trendline, followed by a move through the $88K resistance zone, would signal that buyers are attempting to resume the preceding advance. Conversely, a breakdown below the lower trendline could expose the $81K bullish order block. A loss of this zone would weaken the current bullish structure and could bring the broader $76K demand area back into focus.
On-Chain Demand Signals
The Apparent Demand Growth metric on CryptoQuant measures the net change in Bitcoin supply that has remained inactive for more than one year, adjusted for newly issued coins. Positive readings indicate that apparent demand is absorbing more BTC than the amount of supply entering the market through issuance, while negative readings indicate the opposite.
Historically, sustained positive Apparent Demand Growth has coincided with strong advances in Bitcoin's price. Prolonged negative readings have appeared during periods when price struggled to establish durable upside momentum.
The recent data shows that Apparent Demand Growth has been relatively unstable, with repeated negative readings and intermittent positive spikes. The metric has leaned toward negative territory even as Bitcoin recovered toward the mid-$80K range.
This creates an important divergence between price and the underlying demand signal. Bitcoin has recovered significantly from its summer lows, but the Apparent Demand Growth data does not yet display the sustained positive expansion that accompanied some of the market's stronger historical advances.
The on-chain data suggests that the latest price recovery has not yet been accompanied by a decisive improvement in apparent demand. If the metric turns persistently positive while BTC holds above $80K and challenges the $88K zone, that would provide stronger confirmation for the continuation scenario. However, if negative readings persist while price fails to break $88K, the current consolidation could remain vulnerable to a deeper correction.