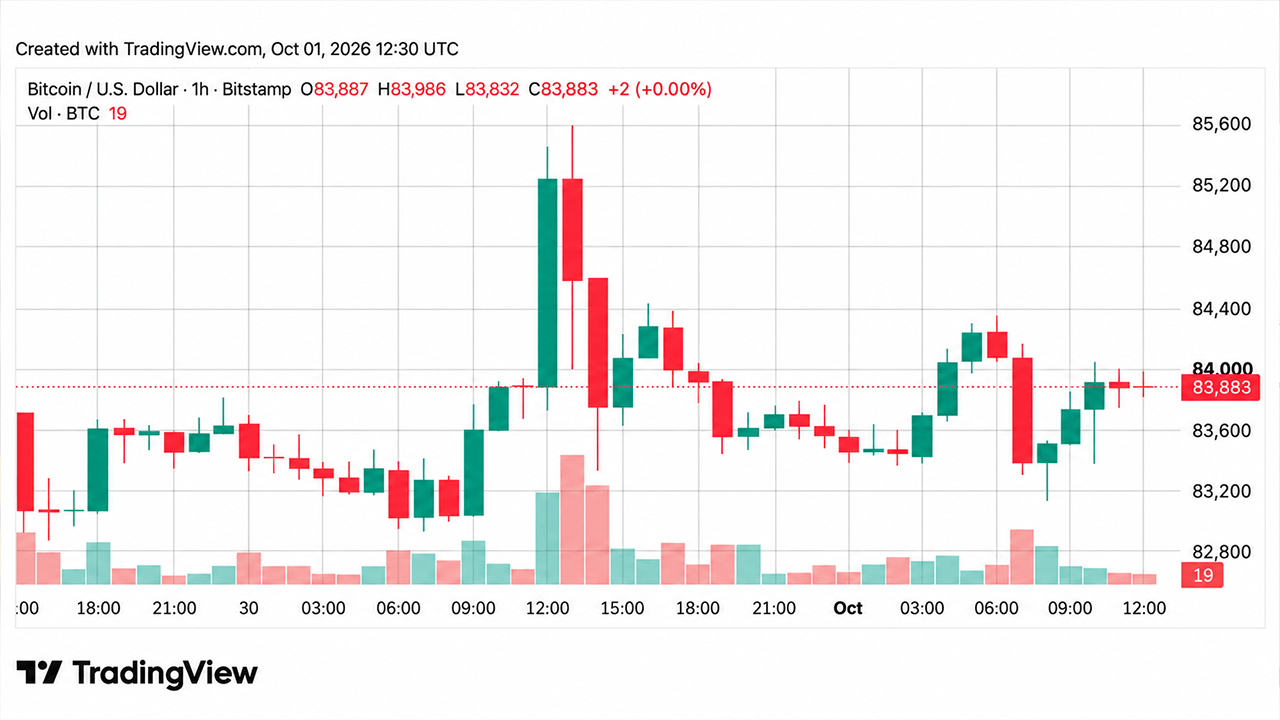
Bitcoin's price remained near $83,900 Thursday morning, with buyers defending support in the low-$83,000s and sellers repeatedly rejecting attempts to break into the mid-$84,000s.
The technical picture shows mixed signals. Moving averages registered 13 bullish readings, while oscillators produced zero bullish signals, leaving the market largely range-bound. Bitcoin needs a daily close above $85,600 or below $82,555 to break out of its current consolidation zone.
Short-Term Price Action
On the 1-hour chart, bitcoin attempted to reach $84,357.92 between 4 and 6 a.m. UTC but failed to hold those gains. The price subsequently retreated to $83,130.14 before recovering toward $83,900 to $84,050, where the rally stalled. Support levels sit at $83,300 and $83,130, with resistance between $84,050 and $84,360.
Weekly Consolidation
The 4-hour chart shows a failed breakout attempt at $85,600 on September 30, which saw 839 BTC in volume but closed considerably lower at $84,077. The market has since returned to its established range between $83,100 and $84,400.
On the daily timeframe, bitcoin has consolidated between $82,555 and $85,600 since September 24, after reaching $87,373.64 on September 21. Buyers have consistently supported the low-$83,000s while sellers have capped advances near $85,100 to $85,600.
Technical Divergence
Moving averages paint a bullish picture, with the 10-period exponential moving average at $83,549 and multiple longer-period averages registering buy signals. Bitcoin trades above all major moving averages except the 10-period simple moving average at $84,285.
Oscillators tell a different story. The relative strength index stands at 63, stochastic at 69, and the average directional index at 41, all reading neutral. Momentum and the moving average convergence divergence both register sell signals, while the Awesome oscillator and other indicators remain neutral. Overall, oscillators produced zero bullish signals and two bearish ones.
Key Levels Ahead
A daily close above $85,600 would reopen the path toward the September 21 high near $87,374. Conversely, a close below $82,555 would break the two-week trading shelf and weaken the broader technical structure. In the near term, breaking above $84,360 would strengthen the short-term setup, while dropping below $83,130 would pressure the current bounce.