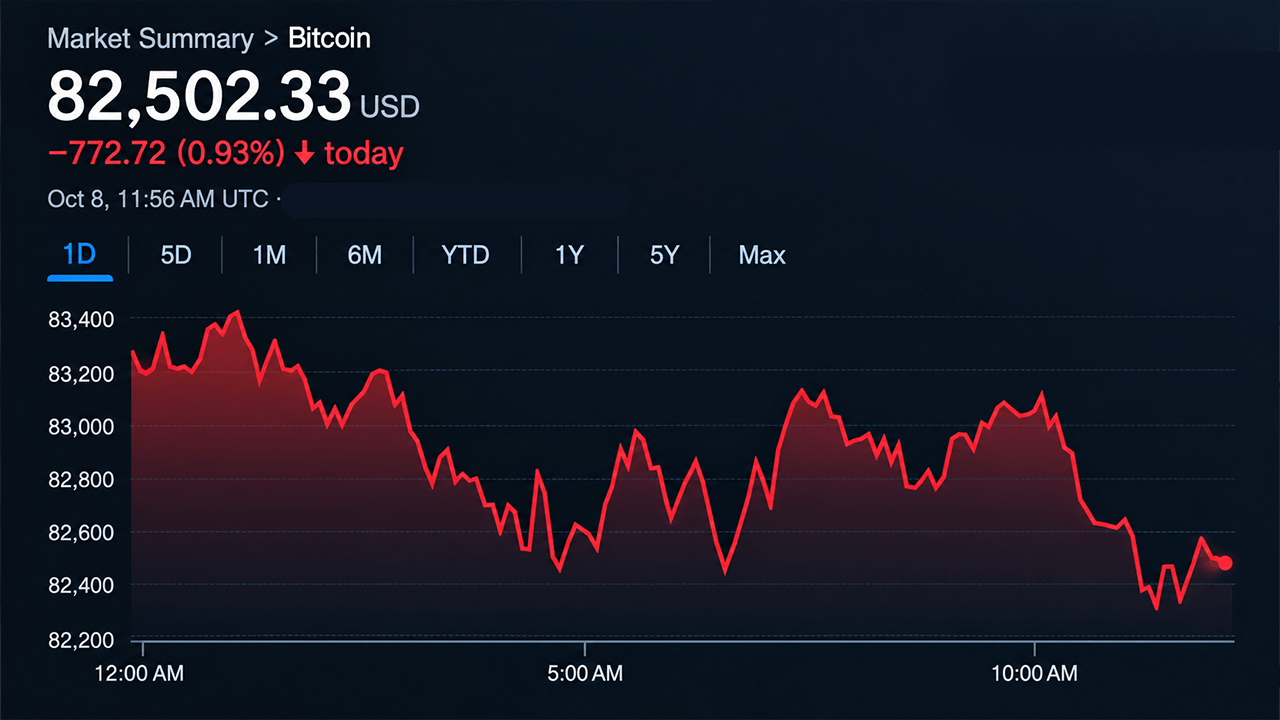
Bitcoin struggled to find stability on October 8, 2026, trading near $82,500 after a sharp selloff from the mid-$85,000s removed more than $3,000 from its price. The $82,180 level emerged as the market's immediate line of defense, while a recovery above $83,500 would signal the first indication of buyer strength returning.
Technical Picture Remains Divided
Despite the recent decline, daily technical indicators presented a neutral outlook, with nine bullish readings, seven bearish readings, and ten neutral signals. This contrasted sharply with hourly and four-hour charts, which reflected considerably more bearish pressure.
On the one-hour chart, Bitcoin fell to $82,179.86 before buyers briefly pushed prices toward $83,211.83. However, the rebound stalled, leaving the cryptocurrency unable to sustain gains above $83,000. The four-hour chart documented successive lower closes from $85,544.34 on October 7, with Bitcoin slipping through multiple price levels before recovering partially to close at $82,933.62.
Key Support and Resistance Levels
Immediate support rested between $82,180 and $82,000, while resistance remained between $83,000 and $83,500. A confirmed four-hour close below $82,180 would strengthen the case for additional losses toward $81,500 and $81,000. Conversely, reclaiming $84,000 would provide an early indication that selling pressure was easing.
Moving Averages Show Mixed Signals
Bitcoin traded beneath its 10-period and 20-period exponential moving averages but remained above its 30-period exponential moving average at $82,175 and 50-period exponential moving average at $79,662. The 200-period simple moving average at $71,802 provided a longer-term cushion despite the immediate retreat.
Daily oscillators offered little consensus, with the relative strength index at 50, indicating neither overbought nor oversold conditions. The average directional index at 41 suggested an established trend, though it did not independently identify direction.