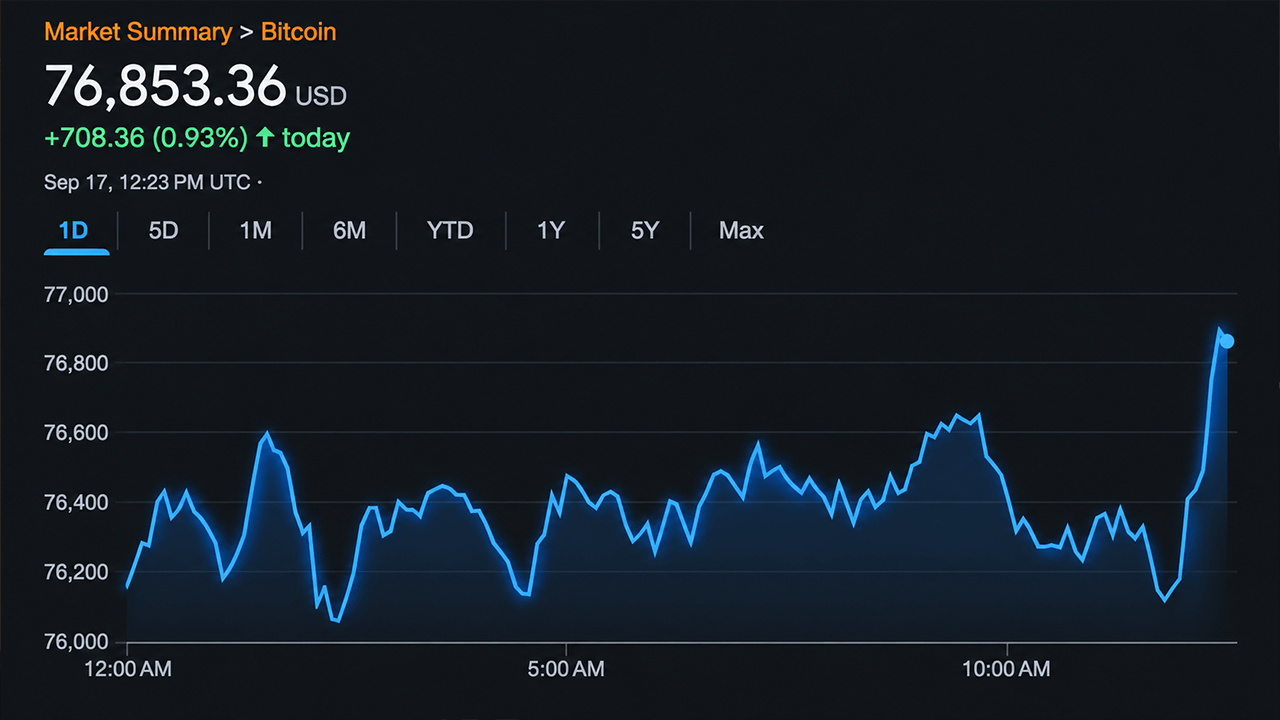
Bitcoin rebounded from a low near $74,962 on Thursday, Sept. 17, and was trading between $76,875 to $77,083 per coin at 8:45 a.m. Eastern time. The recovery remains caught between a broader upward structure and short-term caution signals, with $77,000-$77,200 representing the first significant test for buyers.
Short-Term Price Action
On the 1-hour chart, bitcoin climbed to roughly $76,701 before momentum stalled around $77,000-$77,200. Recent price action shows sellers pressing the price back toward $76,160, with comparatively light volume. The broader intraday picture includes a decline from a recent local high near $79,837, a sharp drop to $74,913, and only a partial recovery since.
Intermediate Timeframe Signals
The 4-hour chart presents a more challenging picture. Bitcoin advanced strongly from an August low near $62,653 to a peak around $82,281, but has since printed lower highs while settling into a $76,000-$78,000 zone. The recent fall from roughly $79,500 to $74,913 was accompanied by noticeable volume spikes on the downside.
Daily Chart Concerns
The daily chart remains the larger concern despite a broader recovery from bitcoin's midyear low near $57,735. Bitcoin reached a high near $82,833 and more recently peaked around $82,281 before entering a sequence of lower highs. The $75,000-$76,000 region represents important support, while a daily close below $75,000 could expose $74,000-$73,000.
Technical Indicators Show Mixed Signals
Daily oscillators are evenly split with two negative, seven neutral, and two positive readings. The relative strength index (RSI) sits at 48. Short-term moving averages lean negative, while the 50-, 100-, and 200-period moving averages remain positive, leaving bitcoin caught between near-term weakness and longer-term support.