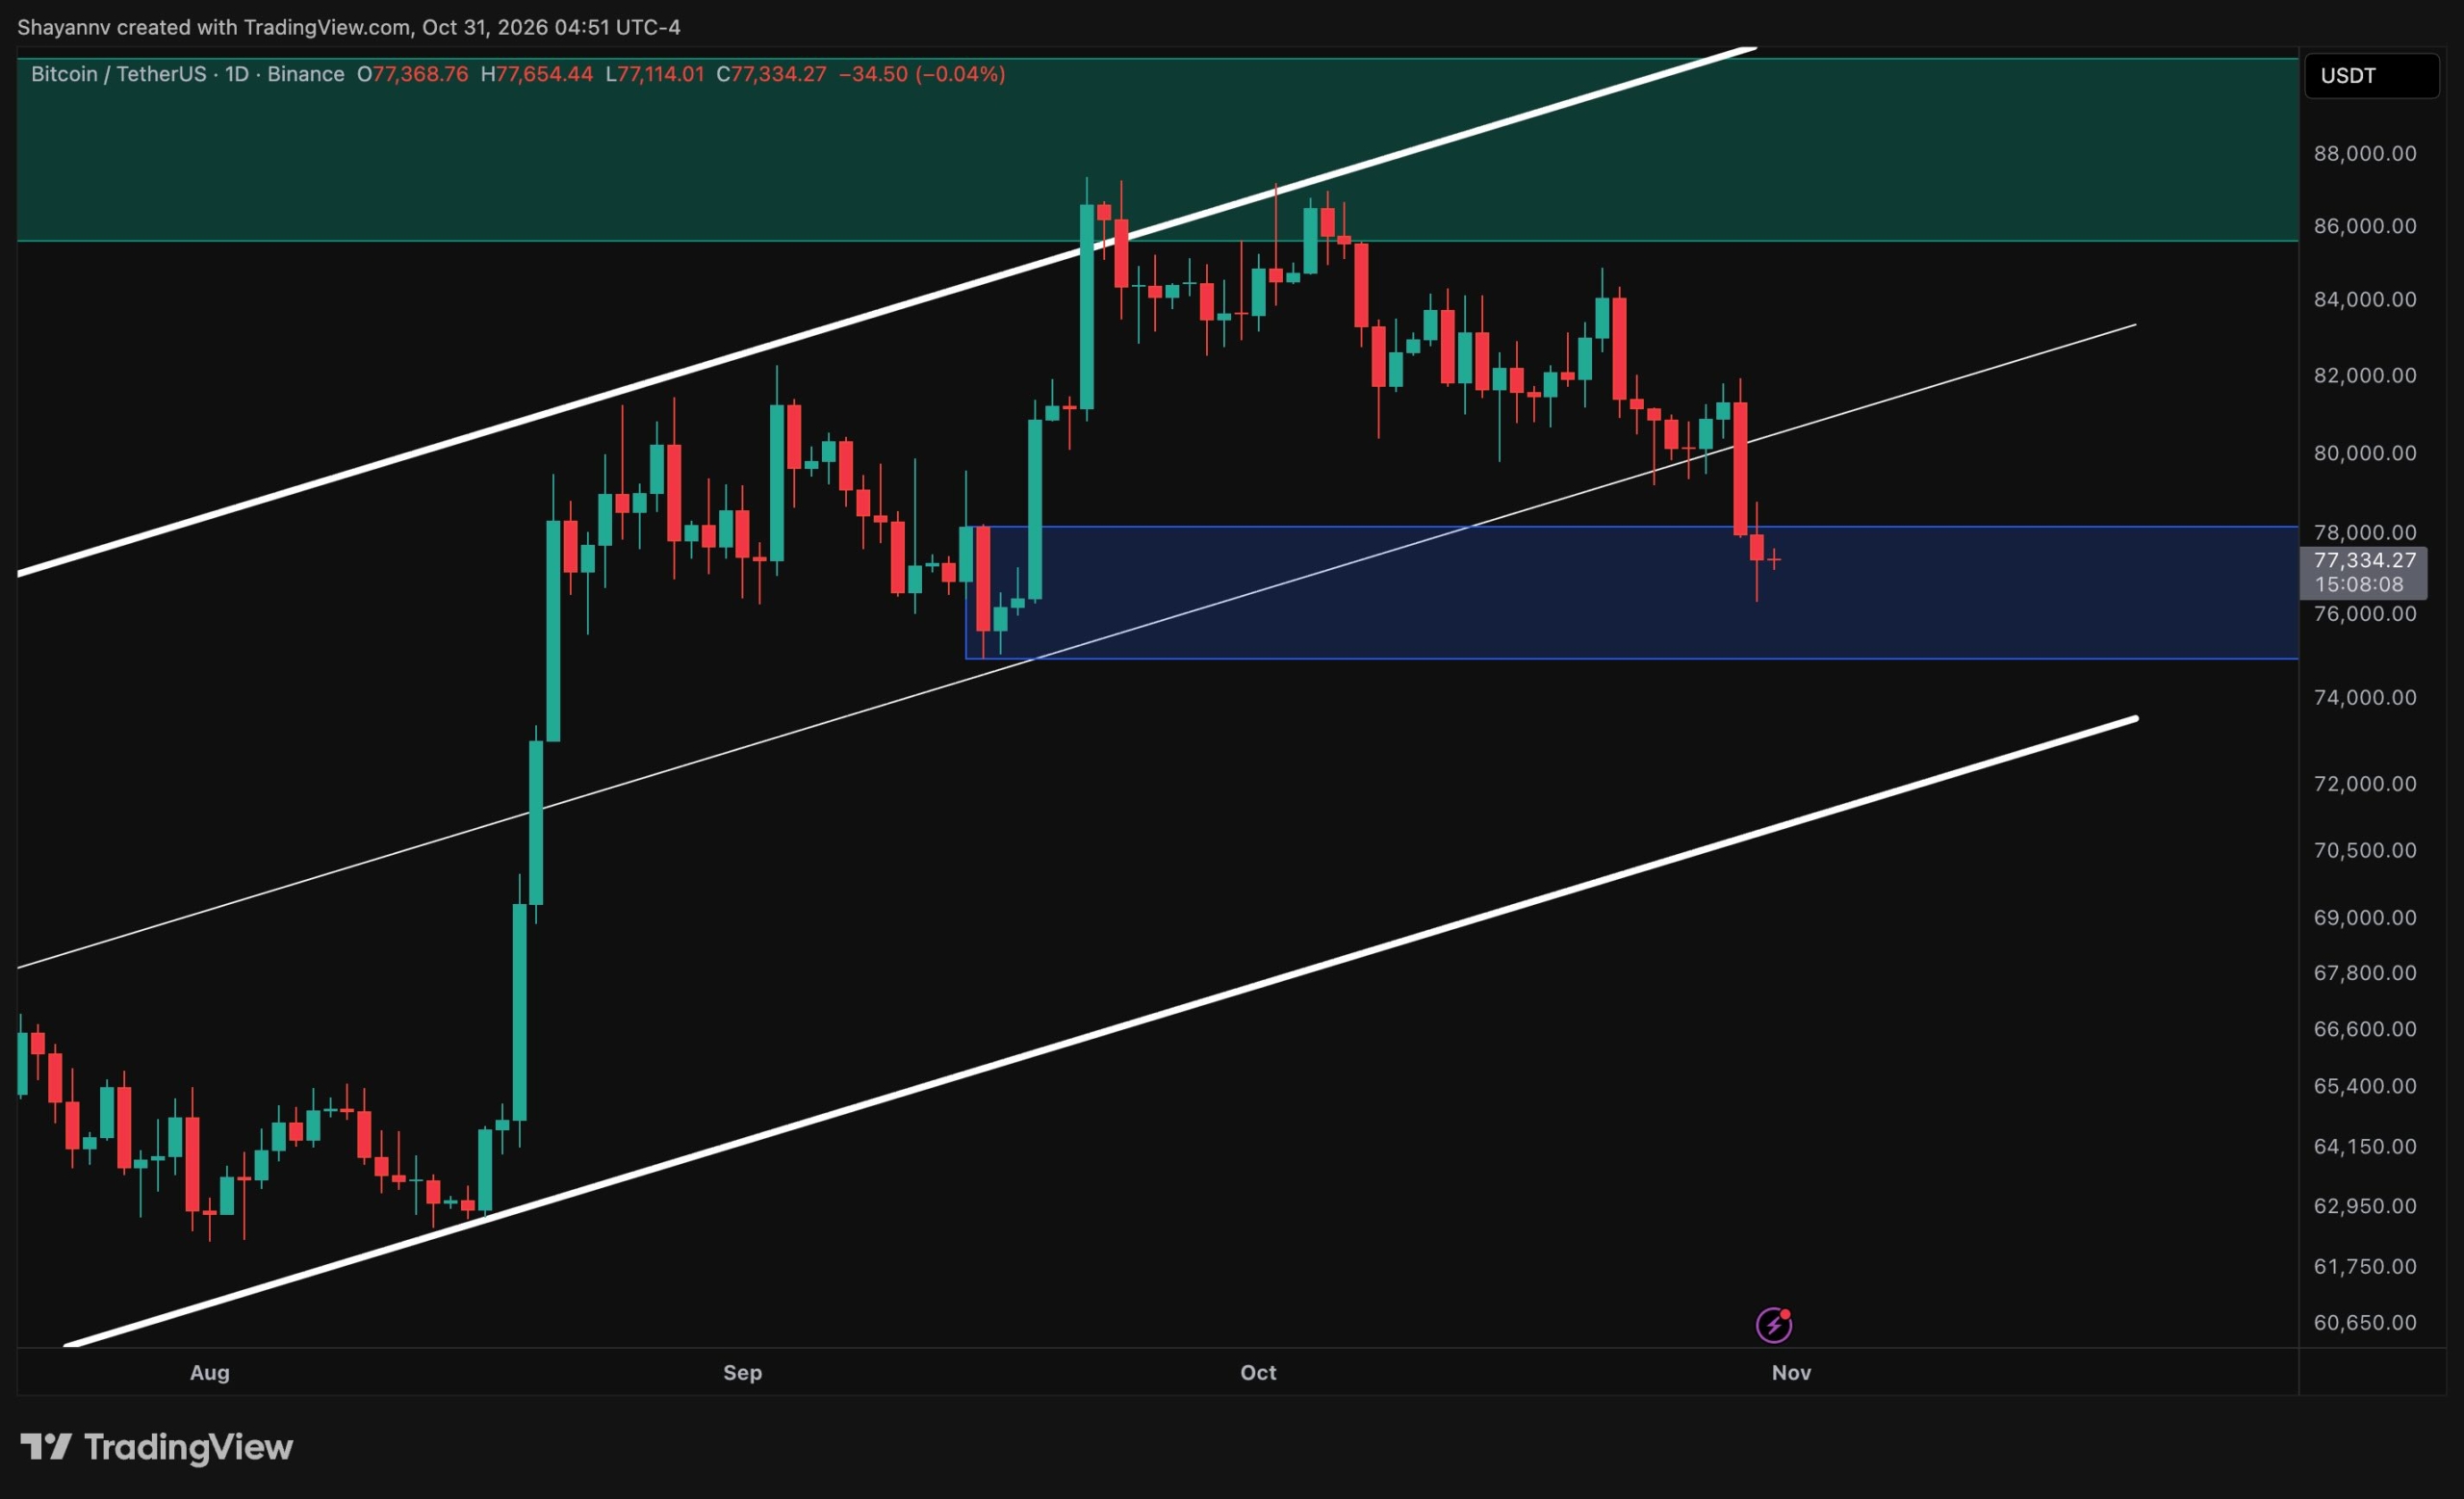
Bitcoin has accelerated its decline into the $77K region following a break below the $80K support area. The cryptocurrency is now testing a major daily demand zone between $75K and $78K, with current price action near $77.7K.
Daily Chart Analysis
On the daily timeframe, Bitcoin has broken beneath the midpoint of an ascending channel, with the sharp bearish move carrying price through $80K into the $75K–$78K demand zone. This region previously supported Bitcoin's September advance, making it a significant test for recovery prospects.
Limited stabilization has followed the selloff, according to technical analysis. A recovery toward $78K–$80K is possible if demand holds, but reclaiming the broken midpoint around $81K would be needed to demonstrate more meaningful improvement. A sustained breakdown below $75K would expose the channel's rising lower boundary near $72K–$73K.
4-Hour Chart Structure
The 4-hour chart shows a sharp breakdown after a failed recovery attempt below a broken ascending trendline. Bitcoin lost the $79.8K support level and declined toward $76.3K before consolidating near $77.3K. The $74.9K–$76.3K zone represents the next immediate defense level.
For upside recovery, the recent consolidation area around $78K–$78.3K presents the first hurdle. Beyond that, the $79.8K–$81.9K zone now represents potential overhead supply resistance.
On-Chain Sentiment Considerations
On-chain data shows Bitcoin approaching the average cost basis of recent holders. The realized price of the 1-to-3-month cohort has risen sharply toward approximately $76K–$76.5K, placing recent holders near aggregate breakeven at current price levels. This creates a confluence with the technical demand zone.
The 6-to-12-month cohort's realized price remains higher at $84K–$85K and could present an additional recovery hurdle if that level is approached.