XRP is attempting to stabilize around $1.25 after briefly slipping toward $1.20 last week, extending a decline that began in late September. The token is now back inside a key support zone, where buyer activity may decide if the correction pauses or moves lower.
Daily Chart Overview
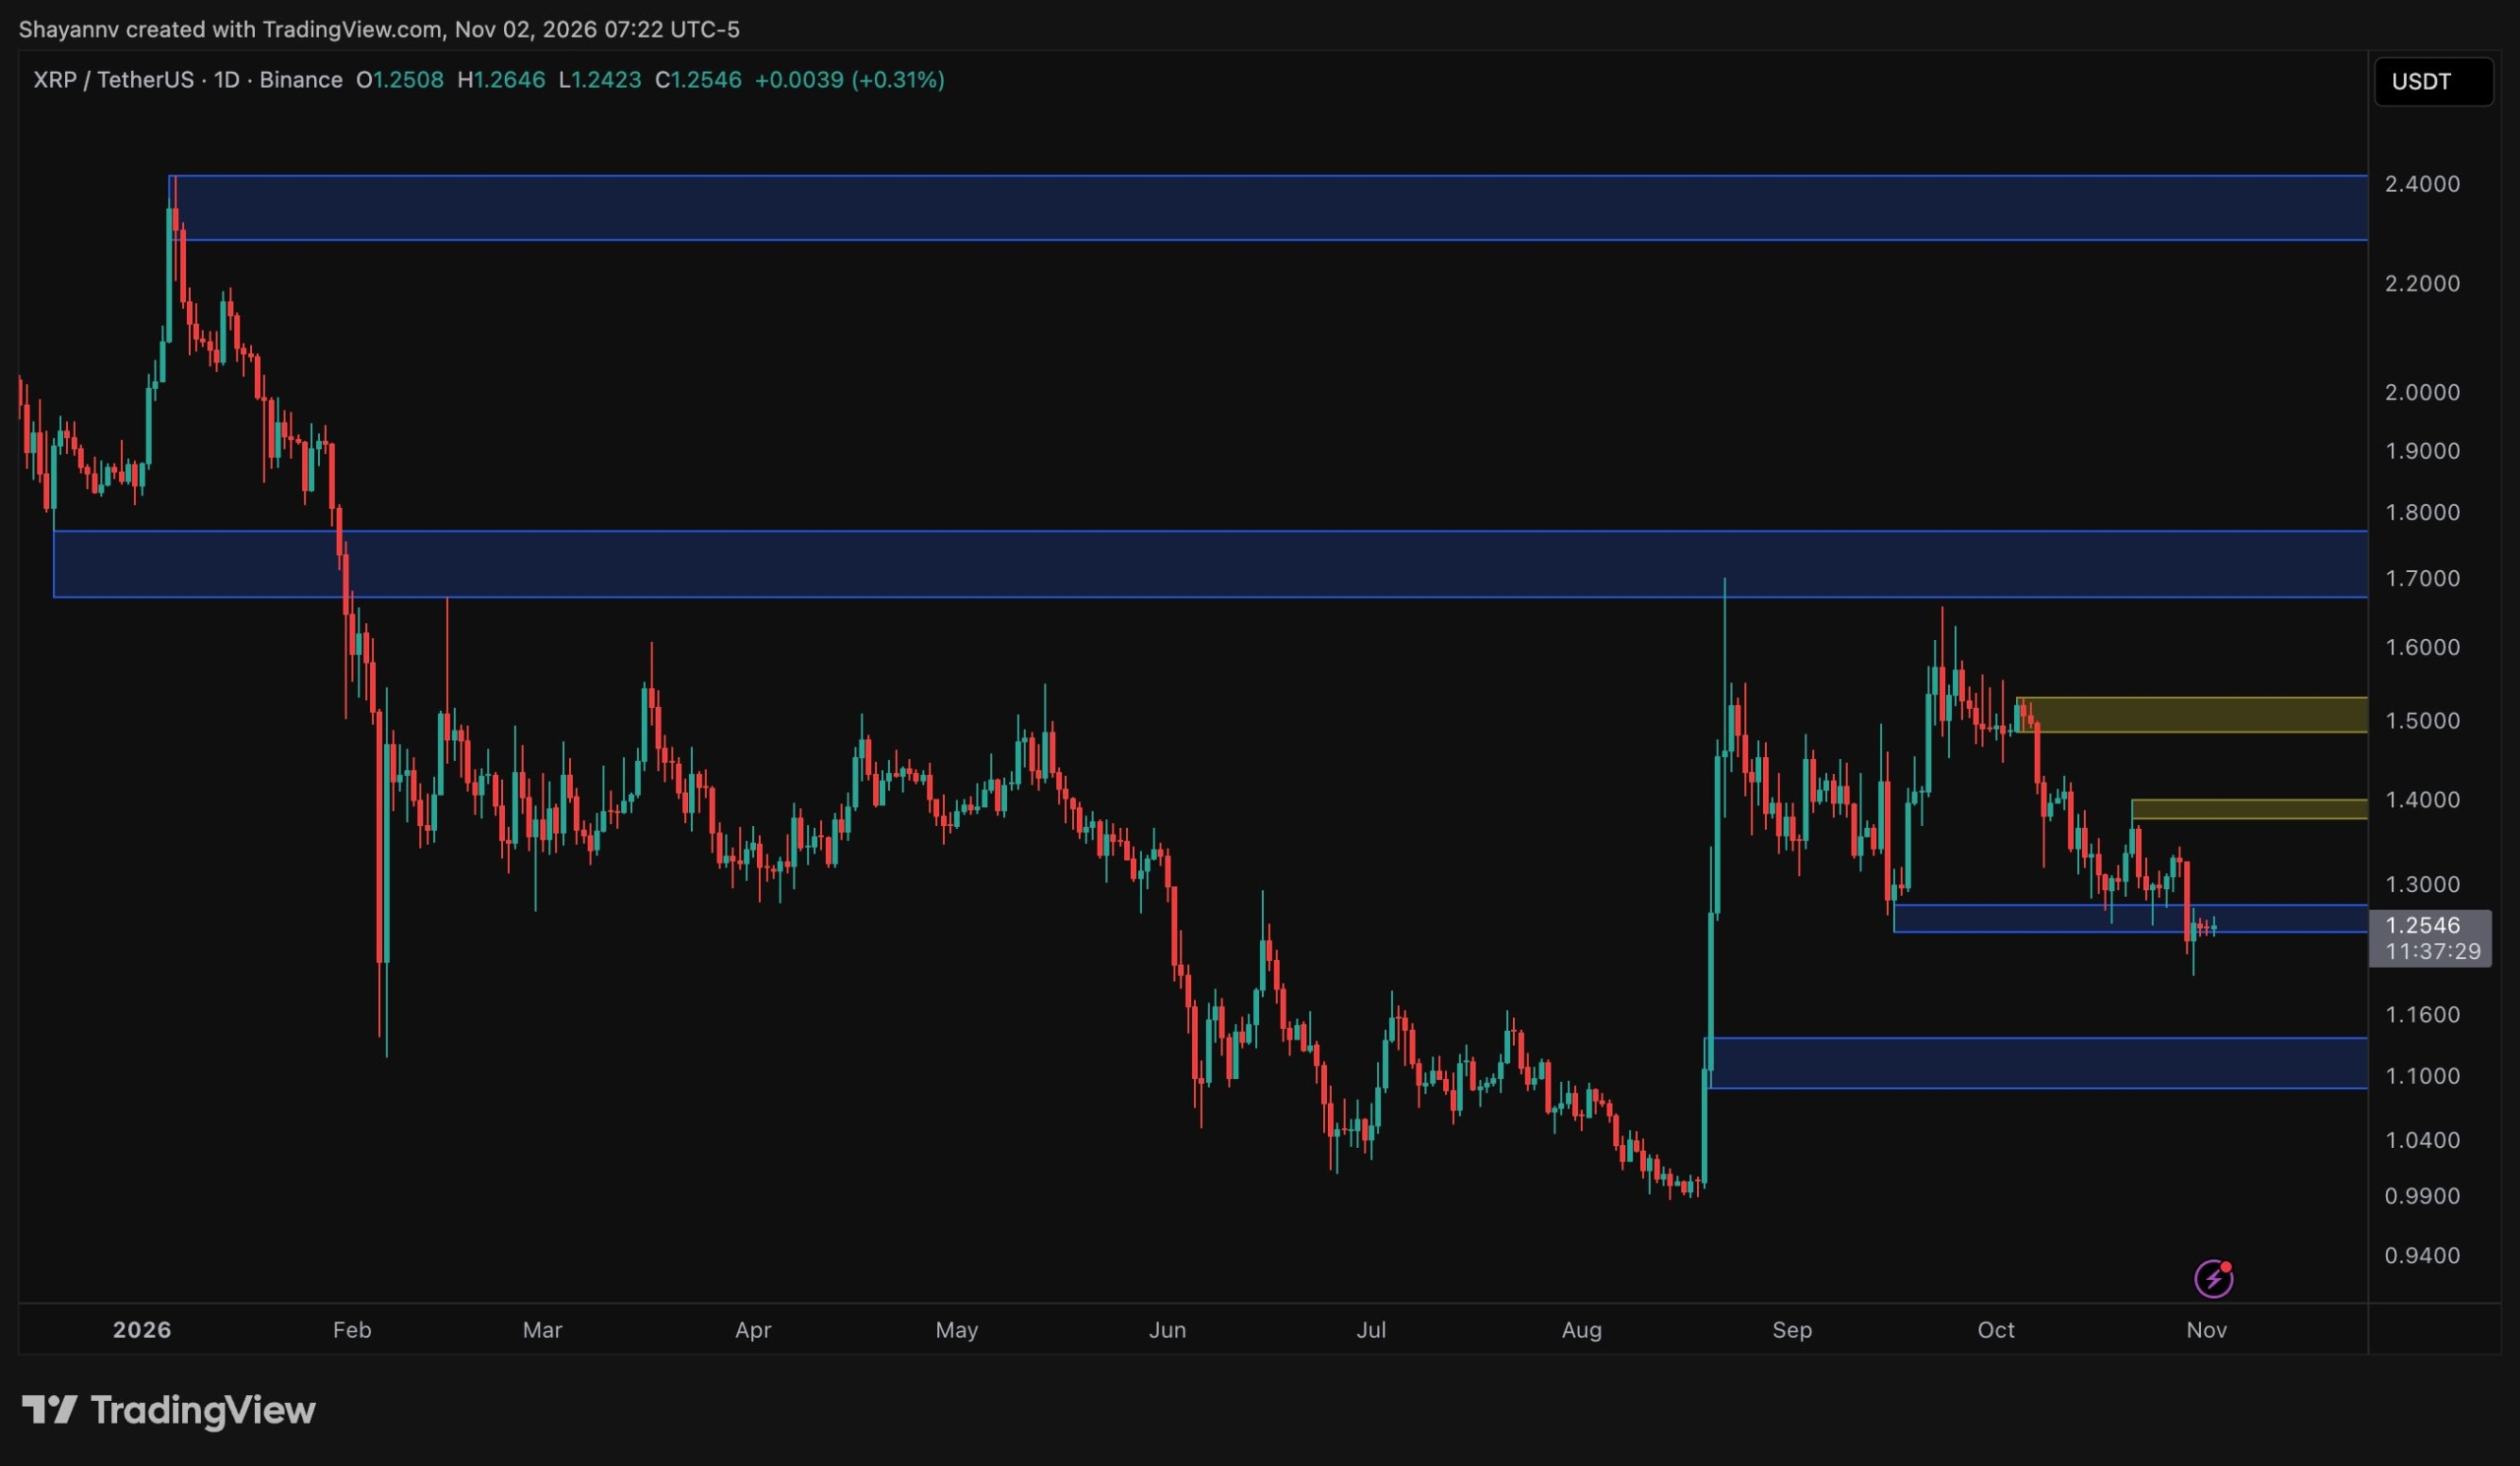
On the daily timeframe, XRP remains in a broader corrective phase that started after early‑2026 highs near $2.40. The August recovery from the $1.00 region stalled just below the $1.70‑$1.80 supply zone, which previously acted as support before the February sell‑off. Subsequent lower highs around $1.65 and $1.40 have kept market structure tilted downward.
The asset is testing the $1.25 zone, which marked September lows before a rally toward $1.65. A recent daily candle dipped below this level to approximately $1.20, but a quick recovery back into the zone suggests buyers are still absorbing selling pressure. Reclaiming the $1.40 supply area would be the first sign of improving structure, followed by the $1.50 region.
A breakdown below $1.25 could expose the $1.10 demand zone, with the $1.00 area serving as a final major floor on the chart.
4‑Hour Chart Details
The 4‑hour chart shows XRP trading within a descending channel since topping near $1.65 in late September, with each rebound producing a lower high. The latest rejection occurred at the channel’s upper boundary around $1.34, triggering a drop below $1.25 support and a wick toward $1.20 before demand re‑emerged.
Since then, the token has been consolidating around $1.25. A move higher would target the upper trendline near $1.28 and could open the way toward the $1.40 supply zone, where sellers intervened during the October rebound.
Conversely, losing the $1.20 swing low would undermine the current stabilization attempt and could push the price toward the channel’s lower boundary near $1.15, with the $1.10 demand zone just below.
Until the upper trendline is cleared, the descending channel remains the dominant short‑term pattern, and rebounds are likely to encounter overhead selling pressure.