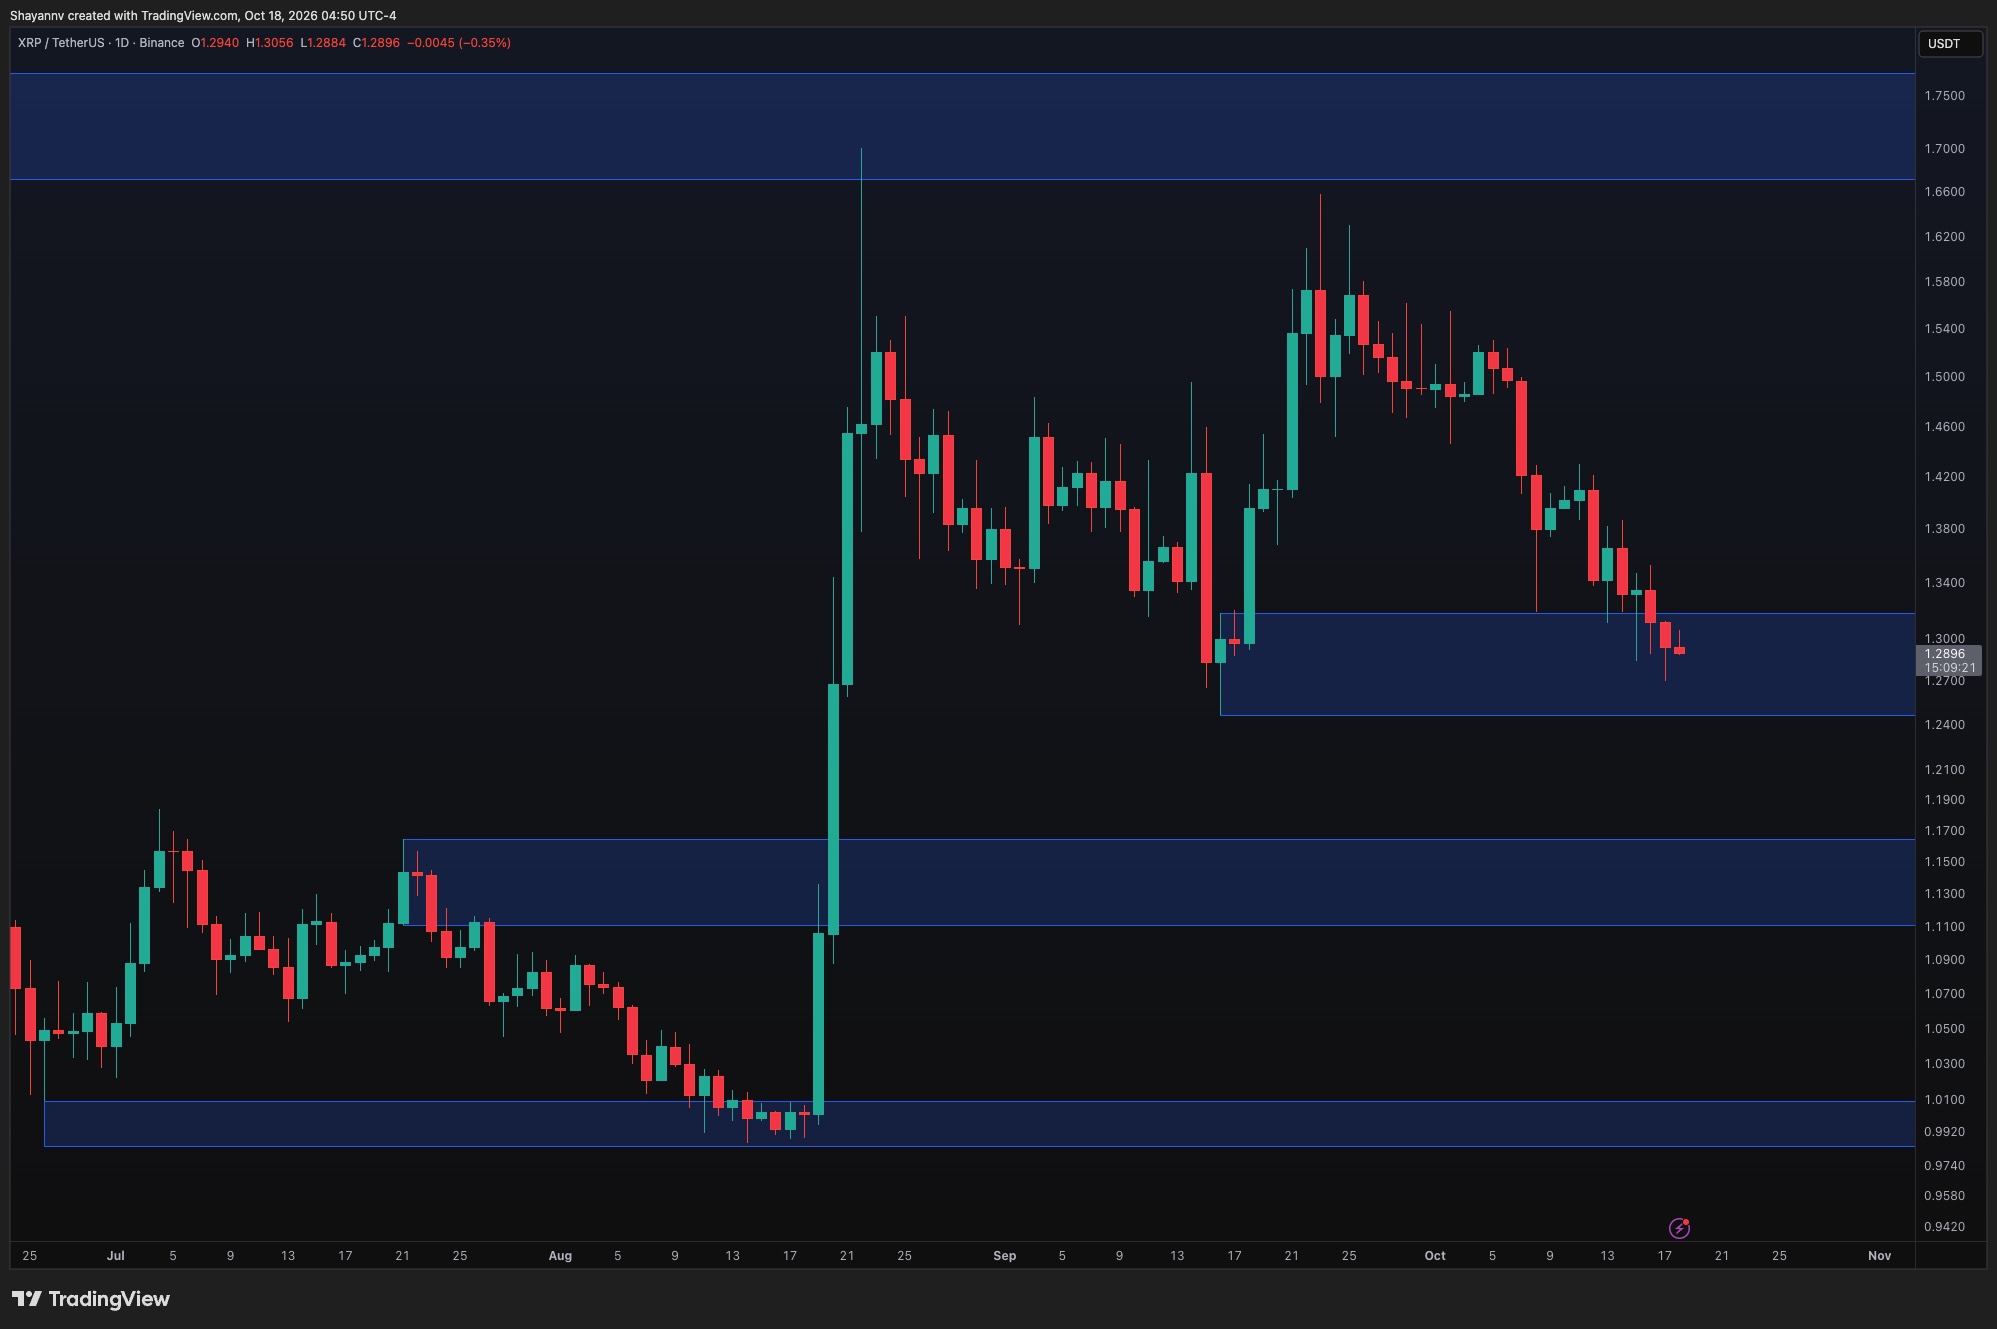
XRP has extended its decline into a key demand zone near $1.30, retreating from September's recovery gains. The cryptocurrency's price action shows a persistent sequence of lower highs and lower lows, keeping the immediate technical outlook bearish.
Daily Chart Levels
On the daily timeframe, XRP has fallen into a highlighted demand zone between $1.24 and $1.32 after failing to maintain its rebound around $1.40. Consecutive bearish candles indicate that sellers remain in control. This zone was historically significant in supporting September's advance, though buyers have yet to mount a comparable response at current levels.
Stabilization followed by a sustained reclaim of $1.32 would provide an initial sign that demand is returning. Such a recovery could potentially support a move toward the $1.38–$1.42 resistance area, where the previous rebound stalled. Conversely, continued weakness through the lower demand boundary around $1.24 would undermine the September base and increase the risk of a deeper correction. The next highlighted daily support sits around $1.11–$1.17.
4-Hour Chart Analysis
The 4-hour chart shows XRP continuing to trade within a descending channel. Recent recoveries have repeatedly stalled beneath the channel's midpoint, while the latest decline has pushed the price into the $1.27–$1.31 support zone near the channel's lower boundary. This confluence of levels could attract buying interest and produce a short-term rebound.
To interrupt the immediate bearish sequence, XRP first needs to reclaim $1.31 and the descending midpoint around $1.32–$1.33. Above that, the recent $1.34–$1.35 swing highs represent another resistance area, followed by the channel's upper boundary near $1.39–$1.40. If buyers fail to defend $1.27, the price could revisit earlier wick lows around $1.25. Sustained acceptance below both support and the descending channel boundary would suggest accelerating selling pressure.