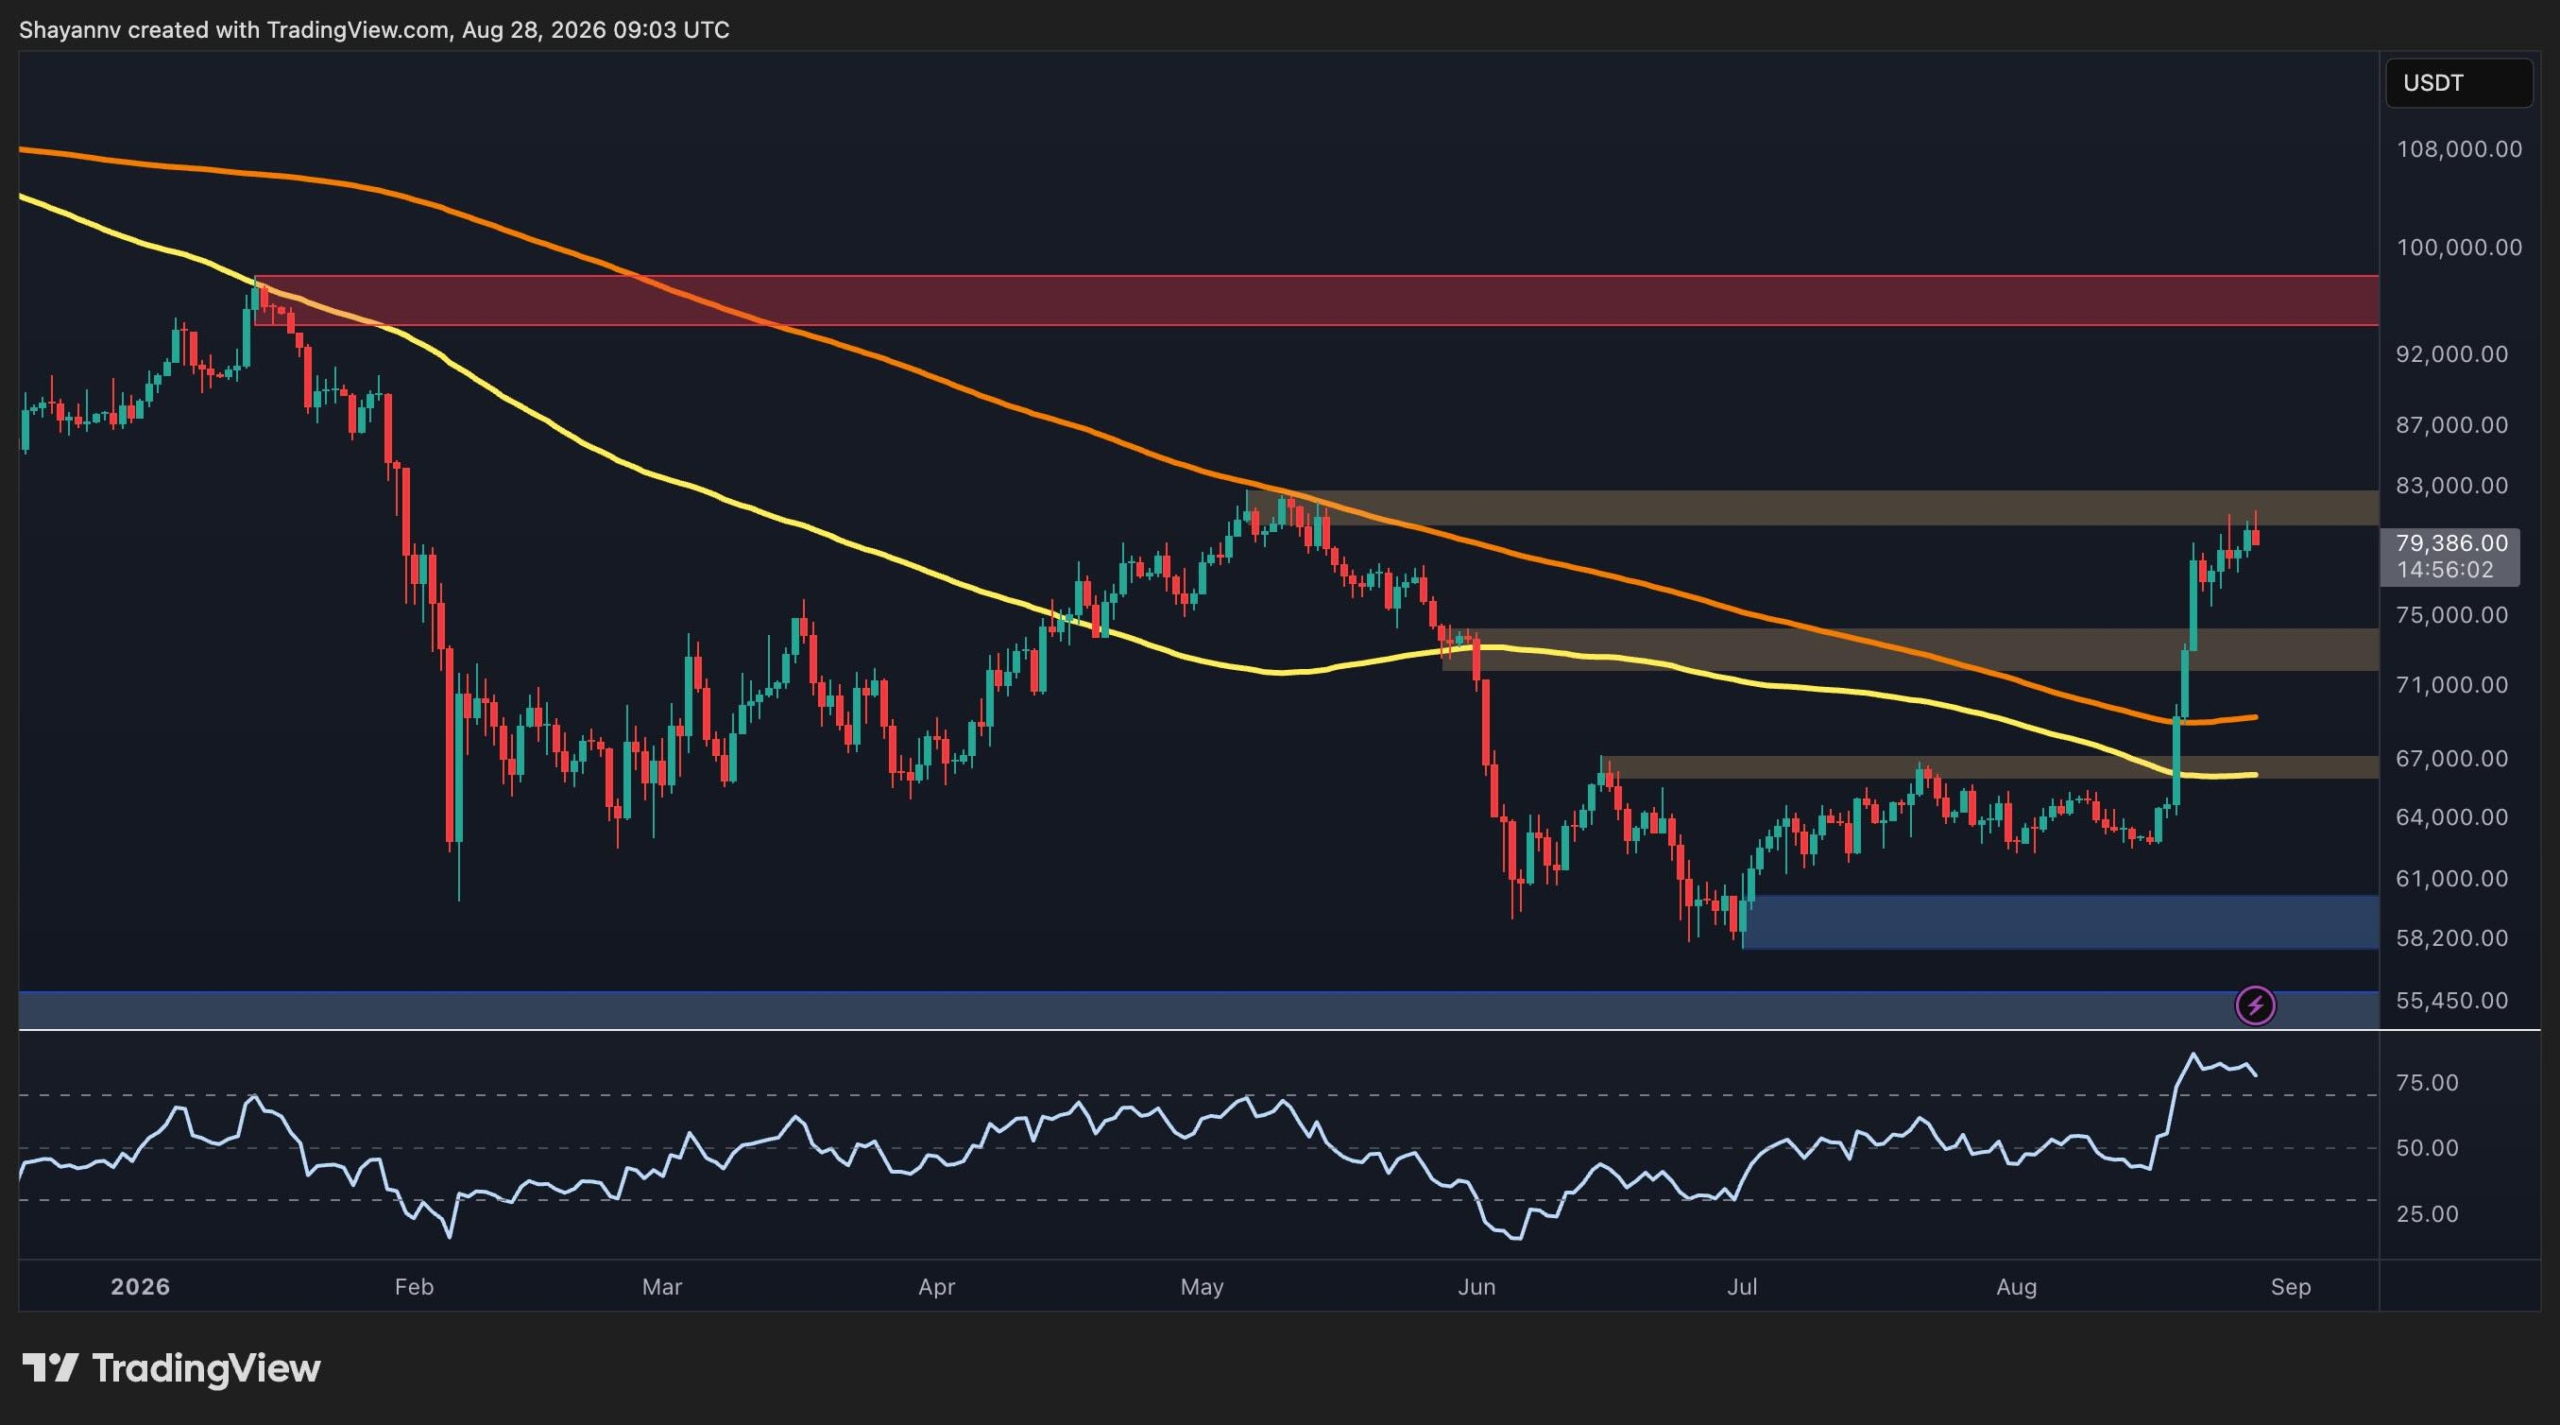
Bitcoin is consolidating near $79K following a breakout from a multi-week consolidation range that had contained the asset below $67K. The move has improved the technical picture, though momentum is showing signs of cooling as BTC approaches key resistance around $80K.
Daily Chart Analysis
The daily chart shows Bitcoin has decisively broken above the consolidation range and reclaimed the $67K resistance zone. The asset then accelerated higher, moving through the $72K–$74K area and reaching the current region near $80K.
Price has moved back above both the 100-day moving average (approximately $67K) and the 200-day moving average (approximately $70K), which are now turning upward. This suggests the medium-term structure is improving after months of downtrend.
Bitcoin is currently testing the $80K resistance zone. A daily close above this level would form a long-term higher high and could open the path toward the $95K resistance region. On the downside, the $72K–$74K area has become the first major support zone following the breakout. If this zone breaks, deeper correction could bring BTC back toward $67K.
Short-Term Consolidation Pattern
The 4-hour chart shows Bitcoin establishing a rising wedge with clear higher lows and higher highs just below $80K. The price is currently trading around $79K and declining toward the lower boundary of the wedge after another rejection from resistance.
The $80K region remains the key area to watch. Bitcoin has tested the lower part of this zone several times but has not yet produced a convincing breakout. A sustained move above $80K would strengthen the continuation setup and potentially expose the next major resistance around $95K.
The short-term RSI has been trending lower while the price was making higher highs, creating a bearish divergence between price and momentum. This suggests that buying pressure may be getting exhausted, even though the underlying price structure remains bullish. Bitcoin could require a period of sideways consolidation before attempting another breakout.
Spot Demand Signals
The Coinbase Premium Index has rebounded sharply and is currently around +0.03 after spending much of the recent period below zero. This recovery coincides with Bitcoin's latest price advance and indicates improved U.S.-based spot demand on Coinbase alongside the breakout.
If the premium remains positive while BTC holds above $75K, this would provide additional confirmation that the rally is supported by spot demand rather than being driven solely by derivatives activity. However, a renewed move below zero while BTC struggles to break above $80K could increase the probability of a short-term correction.