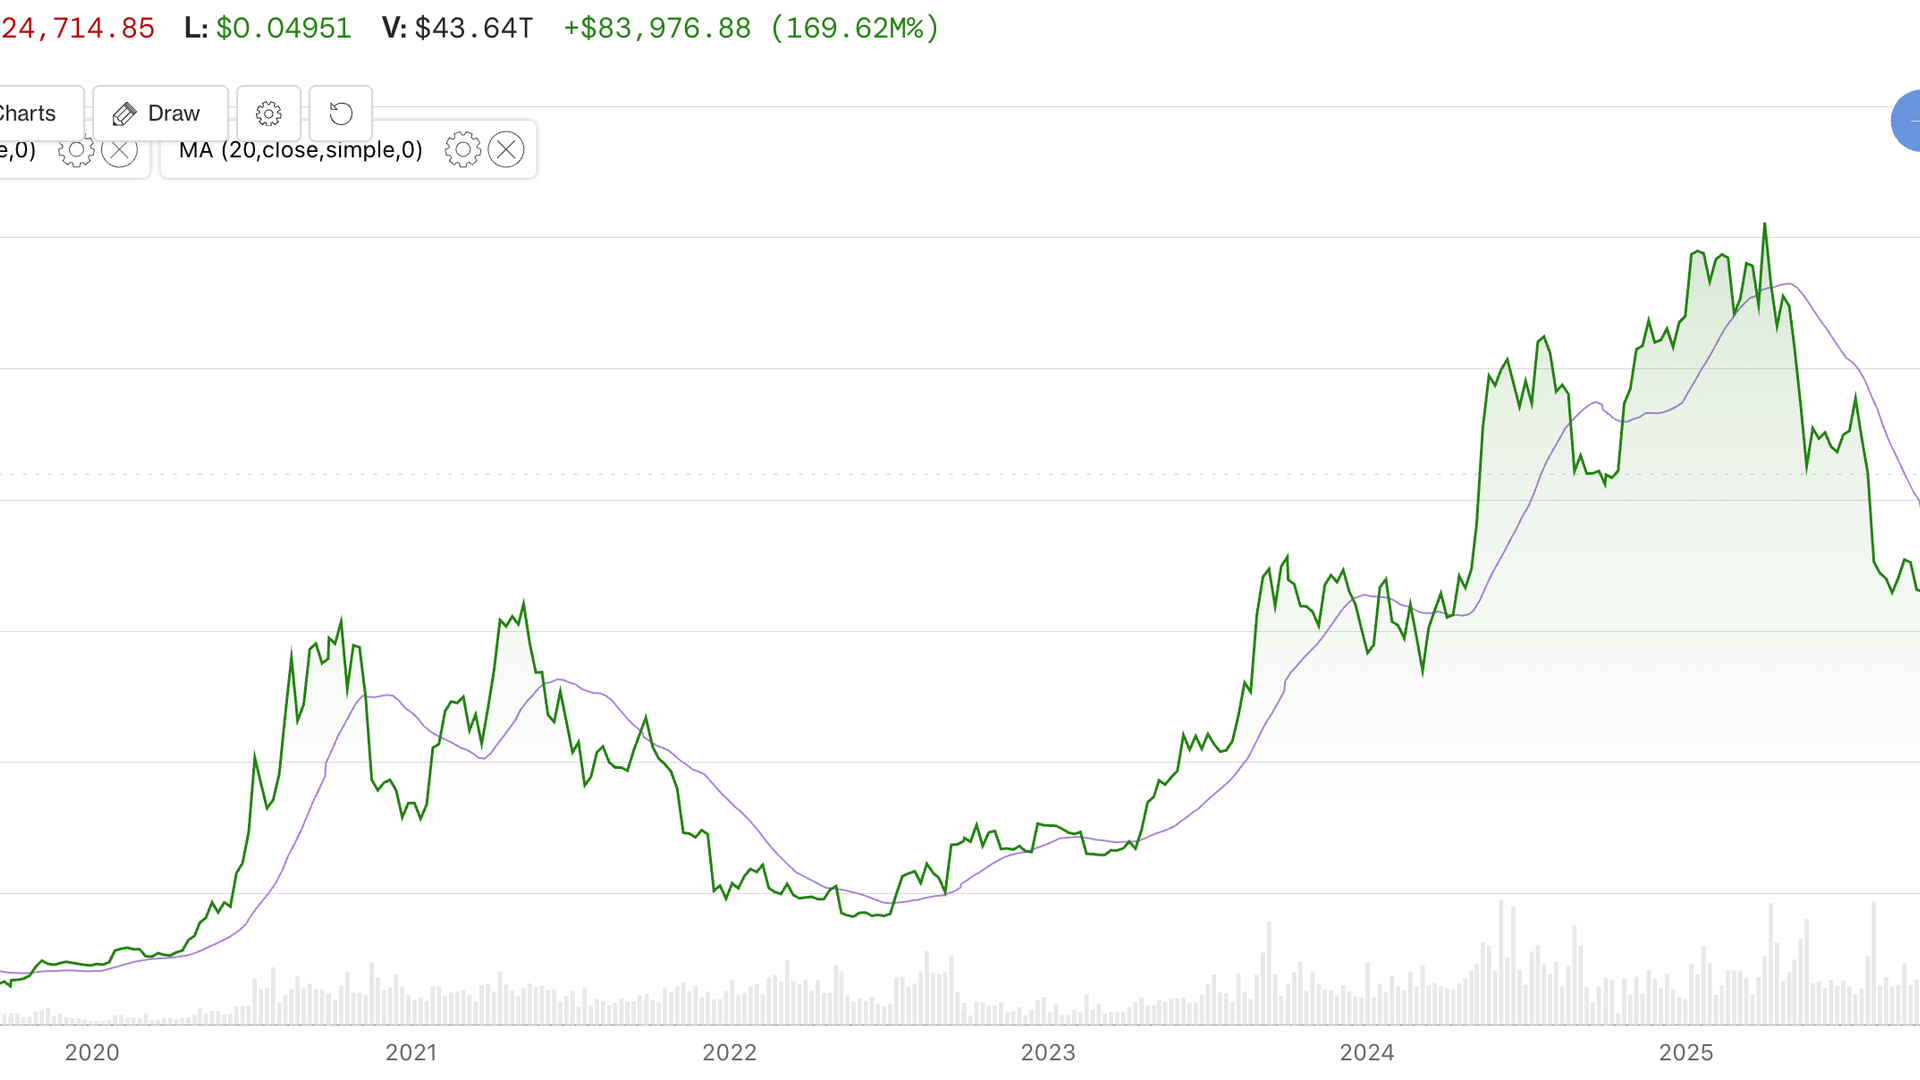
Bitcoin rose above its 365-day moving average on September 22 near $80,900, marking its first time above this level in 310 days. This technical milestone has drawn attention from chart analysts tracking long-term price signals.
Ryan Horst and Joni Zhuleku, founders of Altcoin Pro, identified a potential bullish pattern in this crossover. Historical analysis showed that in five previous instances when bitcoin regained its 365-day average after spending at least 90 days below it, the price was higher 12 months later. Those gains ranged from approximately 59% to more than 1,400%, though earlier instances involved different market conditions.
However, the analysts cautioned that moving-average signals do not guarantee future performance. When Altcoin Pro examined shorter periods below the line, it found two failed breakouts—in July 2018 and March 2022—when bitcoin declined approximately 27% and 59% within 90 days, respectively.
The 200-day average takes priority
Altcoin Pro emphasizes that bitcoin's ability to sustain levels above its 200-day moving average is more critical than the 365-day signal. According to the firm's calculations, the 200-day average stood at approximately $70,800, with bitcoin trading roughly 19% above that level before a recent modest decline.
The 200-day and 365-day moving averages respond differently to market changes. The 365-day average moves more slowly and reflects historical price action from six months prior, while the 200-day average indicates patterns from roughly three months earlier. In fast-moving crypto markets, this three-month difference carries significant trading implications.
The golden cross signal
Bitcoin's 50-day moving average crossed above its 200-day average on September 8, a technical pattern known as a golden cross. This signal has produced mixed results historically, with several past crosses failing to produce sustained rallies. Altcoin Pro argues the current golden cross appears more constructive because it follows a prolonged period of 293 days below the 200-day average, rather than occurring near a market peak. During the 2022-23 bear market, bitcoin spent approximately 436 days below this line.
The near-term technical test will determine whether recent selling pressure pushes bitcoin back toward its 200-day average or whether the cryptocurrency sustains its current levels above this key support level.