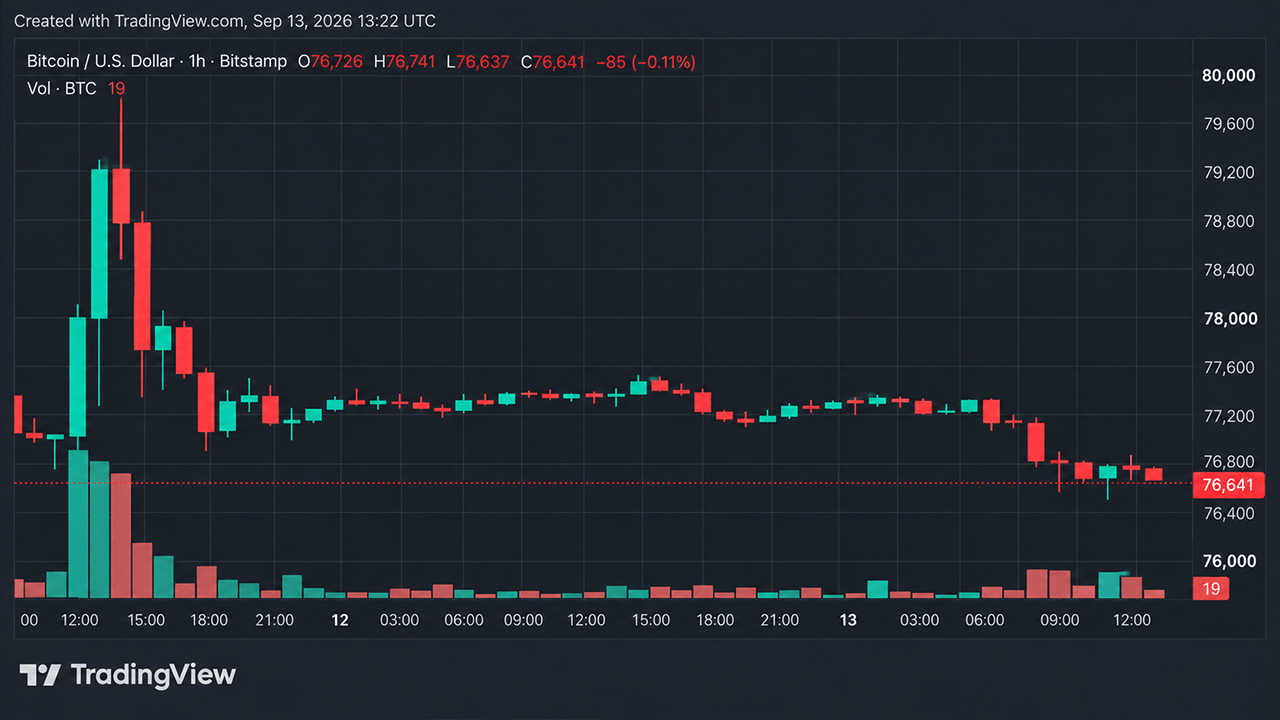
Bitcoin was trading near $76,400 to $76,700 per unit on Sunday morning, following a volatile swing on September 12 that saw the price reach $79,837 before falling to $76,040.
Short-Term Weakness
The 1-hour chart showed bitcoin consolidating between roughly $76,600 and $77,300 after the previous day's sharp move. Buyers clustered around $76,500 to $76,600 while sellers applied pressure around $77,300 to $77,500. Breaking above $77,500 could bring the $79,800 level back into focus, while falling through $76,040 would expose support in the $74,000 to $75,000 range.
On the 4-hour chart, bitcoin displayed lower highs since September 4, drifting back toward the mid-$76,000s after previously reaching $82,281. The $76,400 to $76,600 level represented a critical support zone for buyers.
Longer-Term Context
The daily chart presented a different narrative. Bitcoin remained well above July's $57,735 low and continued to defend the $76,000 to $76,500 neighborhood. A second support layer sat around $74,000 to $75,200, while resistance stretched from $78,500 through $82,800. Bitcoin had been rejected twice around $82,300 to $82,800 without breaking the larger recovery.
Technical Indicator Mixed Signals
Oscillator readings showed a divided market. The relative strength index sat at 53, indicating neutrality, while momentum and moving average convergence divergence leaned bearish. Overall, oscillators registered two bearish signals, eight neutral, and one bullish signal.
Moving averages told a contrasting story. Bitcoin sat below its 10-, 20-period exponential and simple moving averages, creating overhead resistance around $77,000 to $78,550. However, the cryptocurrency remained above every 30-, 50-, 100-, and 200-period moving average, with nine bullish moving averages against five bearish ones.
Key Levels
Bitcoin needed to reclaim roughly $78,500 to strengthen the bullish case. Losing the $76,000 support level would shift the technical picture considerably, potentially opening the way toward $74,000 to $75,200.